Friday, May 3, 2024

Module 7 Google Earth

 Google Earth


For this week's lab we were tasked with creating a dot density map of south Florida in Google Earth. The map also includes a KML file converted from ArcGIS pro of the different surface water features in south Florida. Above is the map I created. The next task we were assigned to do was record a tour going to multiple cities in south Florida to show the 3D models of buildings. For the recording I assigned place marks to easily hop city to city without dragging map around and zooming in and out. 


Sunday, April 28, 2024

Module 6: Isarithmic Mapping

Isarithmic Mapping


For this week's assignment we were tasked with making a Isarithmic Map using data from USDA & the PRISM group at Oregon State University. PRISM is an analytical model that uses point data and an underlying grid such as a digital elevation model (DEM) or a 30-year climatological average (1981- 2010 average) to generate gridded estimates of monthly and annual precipitation and temperature (as well as other climatic parameters). Grids were modeled on a monthly basis. Annual grids of temperature are produced by averaging the monthly grids and summing for precipitation. The raster dataset provides derived average annual precipitation in inches according to a model using point precipitation data for the 30-year period of 1981-2010. 

I used two different symbolization approaches Continuous & Hypsometric tint. Continuous symbology shows a smooth transition for all values, where each point is shaded with a color tone proportional to the data value at that point instead of breaking the values into range groups. The higher precipitation areas were shaded in blue then slowly progressing to green/yellow for moderate precipitation and then finally red for areas that receive very little rain. There is no breaking the values into ranges and continuously flow one color to the next. Hypsometric tinting is a method used in cartography to indicate elevation. It involves placing colors between contour lines (lines of equal elevation) on a map or for this lab, annual precipitation rates. These colors can be shown as bands in a graduated scheme or applied directly to the contour lines themselves. The map above shows the use of hypsometric tinting being used and is guided with the use of contour lines.

Sunday, April 21, 2024

Module 5 Choropleth & Proportional Symbol Mapping

Choropleth & Proportional Symbol Mapping


 For this assignment we were tasked with making a map showing the population density & wine consumption in Europe. The density map is a choropleth map showing the highest density in red and the lower densities in light orange. The wine consumption map uses graduated symbols to show the counties that consume the most wine. The color scheme I choose was the orange to red color scheme. The lower population densities are in shown in a lighter orange color and the higher populations are a bright red. I believe that this color scheme fits best with the idea of higher dense areas are red indicating a busy area while the lighter orange shows the less crowded and less dense areas. This scheme of orange to red best shows the data highlighting which counties have high density compared to the ones that are in a lighter orange that do not. Using the natural breaks method, I believe that this divides the data in a way to evenly distribute the classes so that one class does not have all the data and still highlights the high and low population countries. I choose the graduated symbols. I felt like it best represented and showed the wine consumption data. Albers projection, this projection is equal area conic projections. It uses equal area to ensure areas on map are accurately represented. This map projection is good for choropleth maps on continental scale because all countries can be seen and aren’t distorted making it easy to find smaller countries and make sure that each color for a country is seen well.

Saturday, April 13, 2024

Data Classification

 Data Classification


For this weeks lab we were tasked with creating a compilation map of Miami Dade using the census data that we were provided with and apply what we had learned in lecture about the four different classifications (Equal Interval, Quantile, Standard Deviation, and Natural Breaks). Above I have created the maps adhering to the map guidelines provided. Top left is the map using Equal Interval Classification which creates classes that all have equal ranges in the data. These range values are determined by dividing the total data range by the number of classes. It highlights the extreme values and clusters a large number of the data into a couple categories. Top right is the map using Natural Breaks Classification which in this classification method, class ranges are determined based on algorithms that attempt to make all values within a class as similar to each other as possible, and also as different as possible to values in other classes. Shows extreme values and clusters large group of values together. The bottom left map is using the Quantile Classification method, which divides the distribution into an equal number of observations. Equally divides the total number of values into the desired number of classes. No classes left empty but leads to a wide range of values in certain categories. The bottom right map is using the Standard Deviation Classification method, which is based divisions of the standard deviation such that the area under the graphed curve is divided into equal sections. This method will put the majority of observations in one class surrounding the average value, while other classes will have fewer and fewer data points as they get farther away from the mean. No gaps in legend to confuse map reader. 

Friday, April 12, 2024

Cartographic Design in ArcGis Pro

Cartographic Design in ArcGis Pro


For Module 3 we were tasked with creating a map of public schools in Ward 7, Washington D.C. using Gestalt's principles of Visual Hierarchy, Contrast, Figure Ground, and Balance. We were given certain guidelines to follow as what we need to include in our map and layout, above is the map I created that has everything that we were tasked to create and includes everything that the guidelines state. For this project I used the clip tool to clip all the schools located in ward 7 so that I could work with that data specifically and then used unique symbols to display the different school levels using different size and color for each level. This is an example of visual hierarchy and contrast. I then messed with the colors of roads to make them easier to to see and clipped the roads that weren't in ward 7 because it would make the map less busy, this is an example of contrast and figure grounding. The inset map and main map are lighter colors making them easily identifiable to the user which is another example of figure grounding. I used the principle of balance at the end by making the map look balanced with as least empty space and good color balance. Title and legend are it's own colors which is another example of visual hierarchy. I added curved text to follow the river since it was the only water feature. Labeled neighborhoods by going into attribute table and choosing the neighbor hood that I wanted to represent certain areas located in Ward 7. 

Saturday, April 6, 2024

Typography

 Module 2: Typography


This is a map that I created to show the major swamps and river systems in Florida. This map also displays the major cities and capitol of Florida. The goals of this assignment were to define and insert essential map element's, label a map in accordance with general typographic guidelines, and employ proper type placement for different feature types (point, line, area). 

The map that I created displays all the major city locations, capital, river systems, and swamps areas in Florida. I have provided the source of data, legend, scale bar for reference, compass, and author of map. 

One of the customizations I did for my map was using themed point symbols for the capital and major cities. I customized labels by using a white outline for major cities, capital, and swamps. I also edited the vertices with the river names to make the fit better and more centered on the rivers. I used a green fill color for swamps, I didn’t change color of rivers I liked the baby blue color they already use, and made all counties a deep blue so rivers were more identifiable.


Saturday, March 23, 2024

Map Critique

Map Critique Module: 1

This week's class was an introduction to Cartography and Map design principles. We covered some basic cartography terms, the early cartographic contributors, the history of mapping practices, the different types of maps throughout history, and the common map design principles. 
For this week's lab we were assigned to review and evaluate maps that we could choose. Below are the two maps that I have chosen for my Well-Designed Map and my Poor Designed Map.

This is my idea of a Well-Designed Map.
Map Synopsis: The title is easily identifiable in the top middle of the layout, the layout has two maps to look at which one includes the top ancestry population for each state which is in the top right corner, and the main map shows all the counties in the US and the highest population of each ancestry county by county. The map legend is in alphabetical order of each ancestry and the other symbol has a footnote to show all the other ancestry's that don't have their own symbol. 

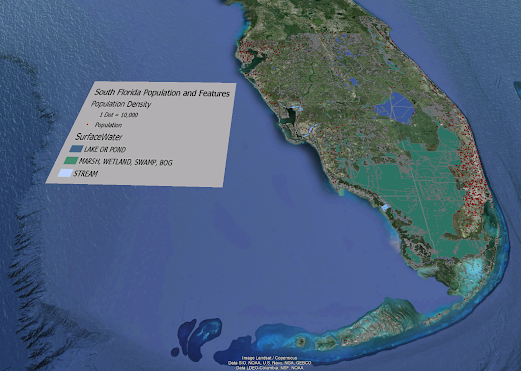
This is my idea of a Poorly Designed Map.
Map Synopsis: This map is very messy at first glance and has no title which leaves the reader confused on what they are even looking at. This map is a map of all the hotels in Barcelona. The map only shows one main street and plaza area, leaving the location markers for the hotels in open white space on the map. The only people that may have use for this map would be locals in the Barcelona area that already know where these locations might be. The scale of map should be bigger to include the other hotels on the map that are not on it and have arrows pointing 250m and 300m. The scale bar for map should be smaller as well.


Module 7 Google Earth

 Google Earth For this week's lab we were tasked with creating a dot density map of south Florida in Google Earth. The map also includes...