Monday, March 27, 2023


 For this weeks lab we used different band combinations to identify different features in Northwest Washington. 

The image on the left shows bare soil features on the map, the areas covered in the red/brownish color are the features covered by bare soil. This was found using the TM False Natural Color which uses the band combination of RGB: 5, 4, 3. 

The image in the middle shows snow features on the map, the areas covered in the yellow and purple colors indicate areas where snow has fallen or could collect due to elevation. This was found using the band combination of RGB: 2, 4, 5. 

The image on the right shows the urban features on the map, the areas covered in grey color are features covered by urban features/development. This was found using the TM False Color IR band combination of RGB: 4, 3, 2.

Monday, March 6, 2023

Land Use Classification Washington State Forest


 For this weeks lab I explored the ERDAS Imagine 32-bit software. I identified how to utilize a subset of the data in the software and export that subset of data to ArcGIS Pro and also identified multiple ways to save, export, and zoom into the different views. The map I created above is the subset of an original image I had explored in ERDAS Imagine 32-bit and after exporting the subset data file into ArcGIS pro, I created a map of the subset area with the land information categorized by the "Class_Names" in the legend and additionally, the area in hectares corresponding to those different land classifications to the right of them in the legend.

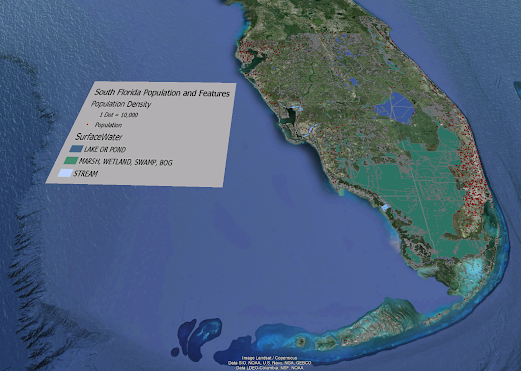
Module 7 Google Earth

 Google Earth For this week's lab we were tasked with creating a dot density map of south Florida in Google Earth. The map also includes...